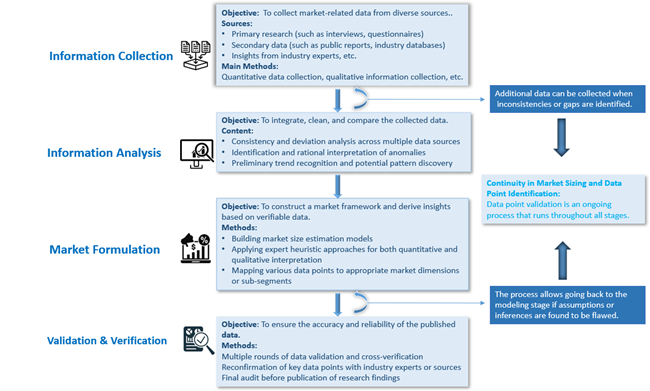
Definition and Scope: Badge dosimeter services refer to the provision of radiation monitoring badges that are worn by individuals working in environments where they may be exposed to radiation. These badges are designed to measure and record the cumulative radiation dose received by the wearer over a specific period. The data collected from these badges is crucial for ensuring the safety of workers and compliance with regulatory requirements in industries such as nuclear power plants, healthcare facilities, and industrial settings where radiation exposure is a concern. Badge dosimeter services typically include badge distribution, collection, analysis of radiation exposure data, and reporting to the relevant authorities. The market for badge dosimeter services is experiencing steady growth due to increasing awareness of the health risks associated with radiation exposure and the need for stringent safety measures in radiation-prone industries. Market trends indicate a rising demand for more advanced dosimeter technologies that offer real-time monitoring capabilities and enhanced data analysis features. Additionally, the growing emphasis on workplace safety regulations and the need for accurate radiation dose monitoring are driving the adoption of badge dosimeter services across various sectors. In addition, advancements in dosimeter technology, such as the integration of wireless connectivity and cloud-based data storage, are further fueling market growth by providing more efficient and convenient monitoring solutions for organizations. The key market drivers for badge dosimeter services include the expanding nuclear power industry, increasing applications of radiation in healthcare for diagnostic and therapeutic purposes, and the growing use of radiation in industrial processes. These factors are contributing to a higher demand for radiation monitoring solutions to ensure the safety of workers and compliance with regulatory standards. Moreover, the rising concerns about potential radiation hazards in the environment and the need for accurate radiation dose assessment in emergency response situations are driving the adoption of badge dosimeter services. Overall, the market for badge dosimeter services is poised for continued growth as organizations prioritize employee safety and regulatory compliance in radiation-exposed work environments. The global Badge Dosimeter Service market size was estimated at USD 696.06 million in 2024, exhibiting a CAGR of 4.20% during the forecast period. This report offers a comprehensive analysis of the global Badge Dosimeter Service market, examining all key dimensions. It provides both a macro-level overview and micro-level market details, including market size, trends, competitive landscape, niche segments, growth drivers, and key challenges. Report Framework and Key Highlights: Market Dynamics: Identification of major market drivers, restraints, opportunities, and challenges. Trend Analysis: Examination of ongoing and emerging trends impacting the market. Competitive Landscape: Detailed profiles and market positioning of major players, including market share, operational status, product offerings, and strategic developments. Strategic Analysis Tools: SWOT Analysis, Porter’s Five Forces Analysis, PEST Analysis, Value Chain Analysis Market Segmentation: By type, application, region, and end-user industry. Forecasting and Growth Projections: In-depth revenue forecasts and CAGR analysis through 2033. This report equips readers with critical insights to navigate competitive dynamics and develop effective strategies. Whether assessing a new market entry or refining existing strategies, the report serves as a valuable tool for: Industry players Investors Researchers Consultants Business strategists And all stakeholders with an interest or investment in the Badge Dosimeter Service market. Global Badge Dosimeter Service Market: Segmentation Analysis and Strategic Insights This section of the report provides an in-depth segmentation analysis of the global Badge Dosimeter Service market. The market is segmented based on region (country), manufacturer, product type, and application. Segmentation enables a more precise understanding of market dynamics and facilitates targeted strategies across product development, marketing, and sales. By breaking the market into meaningful subsets, stakeholders can better tailor their offerings to the specific needs of each segment—enhancing competitiveness and improving return on investment. Global Badge Dosimeter Service Market: Market Segmentation Analysis The research report includes specific segments by region (country), manufacturers, Type, and Application. Market segmentation creates subsets of a market based on product type, end-user or application, Geographic, and other factors. By understanding the market segments, the decision-maker can leverage this targeting in the product, sales, and marketing strategies. Market segments can power your product development cycles by informing how you create product offerings for different segments. Key Companies Profiled CHP Dosimetry Med-Pro Stanford Dosimetry LLC Dosimetry Badge Radiation Detection Company Mirion Technologies Landauer Sierra Radiation Dosimetry Service PL Medical Atomic Energy Industrial Labs Direct Scientific MP Biomedicals Troxler Electronic Laboratories U.S. Dosimetry Technology Inc. Nagase Landauer Ltd. Medlink Imaging Patterson Market Segmentation by Type Monthly Monitoring Bi-Monthly Monitoring Quarterly Monitoring Semi-Annual Monitoring Annual Monitoring Market Segmentation by Application Healthcare Veterinary Government Industry Geographic Segmentation North America: United States, Canada, Mexico Europe: Germany, France, Italy, U.K., Spain, Sweden, Denmark, Netherlands, Switzerland, Belgium, Russia. Asia-Pacific: China, Japan, South Korea, India, Australia, Indonesia, Malaysia, Philippines, Singapore, Thailand South America: Brazil, Argentina, Colombia. Middle East and Africa (MEA): Saudi Arabia, United Arab Emirates, Egypt, Nigeria, South Africa, Rest of MEA Report Framework and Chapter Summary Chapter 1: Report Scope and Market Definition This chapter outlines the statistical boundaries and scope of the report. It defines the segmentation standards used throughout the study, including criteria for dividing the market by region, product type, application, and other relevant dimensions. It establishes the foundational definitions and classifications that guide the rest of the analysis. Chapter 2: Executive Summary This chapter presents a concise summary of the market’s current status and future outlook across different segments—by geography, product type, and application. It includes key metrics such as market size, growth trends, and development potential for each segment. The chapter offers a high-level overview of the Badge Dosimeter Service Market, highlighting its evolution over the short, medium, and long term. Chapter 3: Market Dynamics and Policy Environment This chapter explores the latest developments in the market, identifying key growth drivers, restraints, challenges, and risks faced by industry participants. It also includes an analysis of the policy and regulatory landscape affecting the market, providing insight into how external factors may shape future performance. Chapter 4: Competitive Landscape This chapter provides a detailed assessment of the market's competitive environment. It covers market share, production capacity, output, pricing trends, and strategic developments such as mergers, acquisitions, and expansion plans of leading players. This analysis offers a comprehensive view of the positioning and performance of top competitors. Chapters 5–10: Regional Market Analysis These chapters offer in-depth, quantitative evaluations of market size and growth potential across major regions and countries. Each chapter assesses regional consumption patterns, market dynamics, development prospects, and available capacity. The analysis helps readers understand geographical differences and opportunities in global markets. Chapter 11: Market Segmentation by Product Type This chapter examines the market based on product type, analyzing the size, growth trends, and potential of each segment. It helps stakeholders identify underexplored or high-potential product categories—often referred to as “blue ocean” opportunities. Chapter 12: Market Segmentation by Application This chapter analyzes the market based on application fields, providing insights into the scale and future development of each application segment. It supports readers in identifying high-growth areas across downstream markets. Chapter 13: Company Profiles This chapter presents comprehensive profiles of leading companies operating in the market. For each company, it details sales revenue, volume, pricing, gross profit margin, market share, product offerings, and recent strategic developments. This section offers valuable insight into corporate performance and strategy. Chapter 14: Industry Chain and Value Chain Analysis This chapter explores the full industry chain, from upstream raw material suppliers to downstream application sectors. It includes a value chain analysis that highlights the interconnections and dependencies across various parts of the ecosystem. Chapter 15: Key Findings and Conclusions The final chapter summarizes the main takeaways from the report, presenting the core conclusions, strategic recommendations, and implications for stakeholders. It encapsulates the insights drawn from all previous chapters. Table of Contents 1 Introduction 1.1 Badge Dosimeter Service Market Definition 1.2 Badge Dosimeter Service Market Segments 1.2.1 Segment by Type 1.2.2 Segment by Application 2 Executive Summary 2.1 Global Badge Dosimeter Service Market Size 2.2 Market Segmentation – by Type 2.3 Market Segmentation – by Application 2.4 Market Segmentation – by Geography 3 Key Market Trends, Opportunity, Drivers and Restraints 3.1 Key Takeway 3.2 Market Opportunities & Trends 3.3 Market Drivers 3.4 Market Restraints 3.5 Market Major Factor Assessment 4 Global Badge Dosimeter Service Market Competitive Landscape 4.1 Global Badge Dosimeter Service Market Share by Company (2020-2025) 4.2 Badge Dosimeter Service Market Share by Company Type (Tier 1, Tier 2, and Tier 3) 4.3 New Entrant and Capacity Expansion Plans 4.4 Mergers & Acquisitions 5 Global Badge Dosimeter Service Market by Region 5.1 Global Badge Dosimeter Service Market Size by Region 5.2 Global Badge Dosimeter Service Market Size Market Share by Region 6 North America Market Overview 6.1 North America Badge Dosimeter Service Market Size by Country 6.1.1 USA Market Overview 6.1.2 Canada Market Overview 6.1.3 Mexico Market Overview 6.2 North America Badge Dosimeter Service Market Size by Type 6.3 North America Badge Dosimeter Service Market Size by Application 6.4 Top Players in North America Badge Dosimeter Service Market 7 Europe Market Overview 7.1 Europe Badge Dosimeter Service Market Size by Country 7.1.1 Germany Market Overview 7.1.2 France Market Overview 7.1.3 U.K. Market Overview 7.1.4 Italy Market Overview 7.1.5 Spain Market Overview 7.1.6 Sweden Market Overview 7.1.7 Denmark Market Overview 7.1.8 Netherlands Market Overview 7.1.9 Switzerland Market Overview 7.1.10 Belgium Market Overview 7.1.11 Russia Market Overview 7.2 Europe Badge Dosimeter Service Market Size by Type 7.3 Europe Badge Dosimeter Service Market Size by Application 7.4 Top Players in Europe Badge Dosimeter Service Market 8 Asia-Pacific Market Overview 8.1 Asia-Pacific Badge Dosimeter Service Market Size by Country 8.1.1 China Market Overview 8.1.2 Japan Market Overview 8.1.3 South Korea Market Overview 8.1.4 India Market Overview 8.1.5 Australia Market Overview 8.1.6 Indonesia Market Overview 8.1.7 Malaysia Market Overview 8.1.8 Philippines Market Overview 8.1.9 Singapore Market Overview 8.1.10 Thailand Market Overview 8.2 Asia-Pacific Badge Dosimeter Service Market Size by Type 8.3 Asia-Pacific Badge Dosimeter Service Market Size by Application 8.4 Top Players in Asia-Pacific Badge Dosimeter Service Market 9 South America Market Overview 9.1 South America Badge Dosimeter Service Market Size by Country 9.1.1 Brazil Market Overview 9.1.2 Argentina Market Overview 9.1.3 Columbia Market Overview 9.2 South America Badge Dosimeter Service Market Size by Type 9.3 South America Badge Dosimeter Service Market Size by Application 9.4 Top Players in South America Badge Dosimeter Service Market 10 Middle East and Africa Market Overview 10.1 Middle East and Africa Badge Dosimeter Service Market Size by Country 10.1.1 Saudi Arabia Market Overview 10.1.2 UAE Market Overview 10.1.3 Egypt Market Overview 10.1.4 Nigeria Market Overview 10.1.5 South Africa Market Overview 10.2 Middle East and Africa Badge Dosimeter Service Market Size by Type 10.3 Middle East and Africa Badge Dosimeter Service Market Size by Application 10.4 Top Players in Middle East and Africa Badge Dosimeter Service Market 11 Badge Dosimeter Service Market Segmentation by Type 11.1 Evaluation Matrix of Segment Market Development Potential (Type) 11.2 Global Badge Dosimeter Service Market Share by Type (2020-2033) 12 Badge Dosimeter Service Market Segmentation by Application 12.1 Evaluation Matrix of Segment Market Development Potential (Application) 12.2 Global Badge Dosimeter Service Market Size (M USD) by Application (2020-2033) 12.3 Global Badge Dosimeter Service Sales Growth Rate by Application (2020-2033) 13 Company Profiles 13.1 CHP Dosimetry 13.1.1 CHP Dosimetry Company Overview 13.1.2 CHP Dosimetry Business Overview 13.1.3 CHP Dosimetry Badge Dosimeter Service Major Product Overview 13.1.4 CHP Dosimetry Badge Dosimeter Service Revenue and Gross Margin fromBadge Dosimeter Service (2020-2025) 13.1.5 Key News 13.2 Med-Pro 13.2.1 Med-Pro Company Overview 13.2.2 Med-Pro Business Overview 13.2.3 Med-Pro Badge Dosimeter Service Major Product Overview 13.2.4 Med-Pro Badge Dosimeter Service Revenue and Gross Margin fromBadge Dosimeter Service (2020-2025) 13.2.5 Key News 13.3 Stanford Dosimetry 13.3.1 Stanford Dosimetry Company Overview 13.3.2 Stanford Dosimetry Business Overview 13.3.3 Stanford Dosimetry Badge Dosimeter Service Major Product Overview 13.3.4 Stanford Dosimetry Badge Dosimeter Service Revenue and Gross Margin fromBadge Dosimeter Service (2020-2025) 13.3.5 Key News 13.4 LLC 13.4.1 LLC Company Overview 13.4.2 LLC Business Overview 13.4.3 LLC Badge Dosimeter Service Major Product Overview 13.4.4 LLC Badge Dosimeter Service Revenue and Gross Margin fromBadge Dosimeter Service (2020-2025) 13.4.5 Key News 13.5 Dosimetry Badge 13.5.1 Dosimetry Badge Company Overview 13.5.2 Dosimetry Badge Business Overview 13.5.3 Dosimetry Badge Badge Dosimeter Service Major Product Overview 13.5.4 Dosimetry Badge Badge Dosimeter Service Revenue and Gross Margin fromBadge Dosimeter Service (2020-2025) 13.5.5 Key News 13.6 Radiation Detection Company 13.6.1 Radiation Detection Company Company Overview 13.6.2 Radiation Detection Company Business Overview 13.6.3 Radiation Detection Company Badge Dosimeter Service Major Product Overview 13.6.4 Radiation Detection Company Badge Dosimeter Service Revenue and Gross Margin fromBadge Dosimeter Service (2020-2025) 13.6.5 Key News 13.7 Mirion Technologies 13.7.1 Mirion Technologies Company Overview 13.7.2 Mirion Technologies Business Overview 13.7.3 Mirion Technologies Badge Dosimeter Service Major Product Overview 13.7.4 Mirion Technologies Badge Dosimeter Service Revenue and Gross Margin fromBadge Dosimeter Service (2020-2025) 13.7.5 Key News 13.8 Landauer 13.8.1 Landauer Company Overview 13.8.2 Landauer Business Overview 13.8.3 Landauer Badge Dosimeter Service Major Product Overview 13.8.4 Landauer Badge Dosimeter Service Revenue and Gross Margin fromBadge Dosimeter Service (2020-2025) 13.8.5 Key News 13.9 Sierra Radiation Dosimetry Service 13.9.1 Sierra Radiation Dosimetry Service Company Overview 13.9.2 Sierra Radiation Dosimetry Service Business Overview 13.9.3 Sierra Radiation Dosimetry Service Badge Dosimeter Service Major Product Overview 13.9.4 Sierra Radiation Dosimetry Service Badge Dosimeter Service Revenue and Gross Margin fromBadge Dosimeter Service (2020-2025) 13.9.5 Key News 13.10 PL Medical 13.10.1 PL Medical Company Overview 13.10.2 PL Medical Business Overview 13.10.3 PL Medical Badge Dosimeter Service Major Product Overview 13.10.4 PL Medical Badge Dosimeter Service Revenue and Gross Margin fromBadge Dosimeter Service (2020-2025) 13.10.5 Key News 13.11 Atomic Energy Industrial Labs 13.11.1 Atomic Energy Industrial Labs Company Overview 13.11.2 Atomic Energy Industrial Labs Business Overview 13.11.3 Atomic Energy Industrial Labs Badge Dosimeter Service Major Product Overview 13.11.4 Atomic Energy Industrial Labs Badge Dosimeter Service Revenue and Gross Margin fromBadge Dosimeter Service (2020-2025) 13.11.5 Key News 13.12 Direct Scientific 13.12.1 Direct Scientific Company Overview 13.12.2 Direct Scientific Business Overview 13.12.3 Direct Scientific Badge Dosimeter Service Major Product Overview 13.12.4 Direct Scientific Badge Dosimeter Service Revenue and Gross Margin fromBadge Dosimeter Service (2020-2025) 13.12.5 Key News 13.13 MP Biomedicals 13.13.1 MP Biomedicals Company Overview 13.13.2 MP Biomedicals Business Overview 13.13.3 MP Biomedicals Badge Dosimeter Service Major Product Overview 13.13.4 MP Biomedicals Badge Dosimeter Service Revenue and Gross Margin fromBadge Dosimeter Service (2020-2025) 13.13.5 Key News 13.14 Troxler Electronic Laboratories 13.14.1 Troxler Electronic Laboratories Company Overview 13.14.2 Troxler Electronic Laboratories Business Overview 13.14.3 Troxler Electronic Laboratories Badge Dosimeter Service Major Product Overview 13.14.4 Troxler Electronic Laboratories Badge Dosimeter Service Revenue and Gross Margin fromBadge Dosimeter Service (2020-2025) 13.14.5 Key News 13.15 U.S. Dosimetry Technology 13.15.1 U.S. Dosimetry Technology Company Overview 13.15.2 U.S. Dosimetry Technology Business Overview 13.15.3 U.S. Dosimetry Technology Badge Dosimeter Service Major Product Overview 13.15.4 U.S. Dosimetry Technology Badge Dosimeter Service Revenue and Gross Margin fromBadge Dosimeter Service (2020-2025) 13.15.5 Key News 13.16 Inc. 13.16.1 Inc. Company Overview 13.16.2 Inc. Business Overview 13.16.3 Inc. Badge Dosimeter Service Major Product Overview 13.16.4 Inc. Badge Dosimeter Service Revenue and Gross Margin fromBadge Dosimeter Service (2020-2025) 13.16.5 Key News 13.17 Nagase Landauer Ltd. 13.17.1 Nagase Landauer Ltd. Company Overview 13.17.2 Nagase Landauer Ltd. Business Overview 13.17.3 Nagase Landauer Ltd. Badge Dosimeter Service Major Product Overview 13.17.4 Nagase Landauer Ltd. Badge Dosimeter Service Revenue and Gross Margin fromBadge Dosimeter Service (2020-2025) 13.17.5 Key News 13.18 Medlink Imaging 13.18.1 Medlink Imaging Company Overview 13.18.2 Medlink Imaging Business Overview 13.18.3 Medlink Imaging Badge Dosimeter Service Major Product Overview 13.18.4 Medlink Imaging Badge Dosimeter Service Revenue and Gross Margin fromBadge Dosimeter Service (2020-2025) 13.18.5 Key News 13.19 Patterson 13.19.1 Patterson Company Overview 13.19.2 Patterson Business Overview 13.19.3 Patterson Badge Dosimeter Service Major Product Overview 13.19.4 Patterson Badge Dosimeter Service Revenue and Gross Margin fromBadge Dosimeter Service (2020-2025) 13.19.5 Key News 14 Key Market Trends, Opportunity, Drivers and Restraints 14.1 Key Takeway 14.2 Market Opportunities & Trends 14.3 Market Drivers 14.4 Market Restraints 14.5 Market Major Factor Assessment 14.6 Porter's Five Forces Analysis of Badge Dosimeter Service Market 14.7 PEST Analysis of Badge Dosimeter Service Market 15 Analysis of the Badge Dosimeter Service Industry Chain 15.1 Overview of the Industry Chain 15.2 Upstream Segment Analysis 15.3 Midstream Segment Analysis 15.3.1 Manufacturing, Processing or Conversion Process Analysis 15.3.2 Key Technology Analysis 15.4 Downstream Segment Analysis 15.4.1 Downstream Customer List and Contact Details 15.4.2 Customer Concerns or Preference Analysis 16 Conclusion 17 Appendix 17.1 Methodology 17.2 Research Process and Data Source 17.3 Disclaimer 17.4 Note 17.5 Examples of Clients 17.6 DisclaimerResearch Methodology The research methodology employed in this study follows a structured, four-stage process designed to ensure the accuracy, consistency, and relevance of all data and insights presented. The process begins with Information Procurement, wherein data is collected from a wide range of primary and secondary sources. This is followed by Information Analysis, during which the collected data is systematically mapped, discrepancies across sources are examined, and consistency is established through cross-validation.
Subsequently, the Market Formulation phase involves placing verified data points into an appropriate market context to generate meaningful conclusions. This step integrates analyst interpretation and expert heuristics to refine findings and ensure applicability. Finally, all conclusions undergo a rigorous Validation and Publishing process, where each data point is re-evaluated before inclusion in the final deliverable. The methodology emphasizes bidirectional flow and reversibility between key stages to maintain flexibility and reinforce the integrity of the analysis.
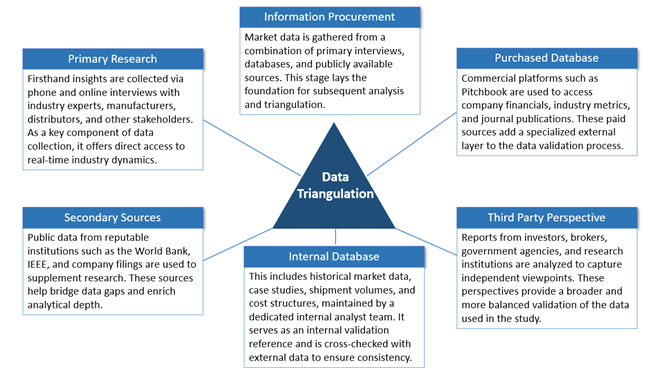
Research Process The market research process follows a structured and iterative methodology designed to ensure accuracy, depth, and reliability. It begins with scope definition and research design, where the research objectives are clearly outlined based on client requirements, emerging market trends, and initial exploratory insights. This phase provides strategic direction for all subsequent stages of the research. Data collection is then conducted through both secondary and primary research. Secondary research involves analyzing publicly available and paid sources such as company filings, industry journals, and government databases to build foundational knowledge. This is followed by primary research, which includes direct interviews and surveys with key industry stakeholders—such as manufacturers, distributors, and end users—to gather firsthand insights and address data gaps identified earlier. Techniques included CATI (Computer-Assisted Telephonic Interviewing), CAWI (Computer-Assisted Web Interviewing), CAVI (Computer-Assisted Video Interviewing via platforms like Zoom and WebEx), and CASI (Computer-Assisted Self Interviewing via email or LinkedIn).